Set thematic map operation manual according to field value
Overview
In the process of data processing, there are often situations in which it is necessary to count the attribute values of a field according to a certain standard. At this time, using different colors to indicate the different value ranges of the field will make the value of each segment of the attribute and the geographic spatial distribution more clear. For example, the number and distribution of super-high floors in a certain city, the use of urban land, etc., using thematic maps can make data spatial distribution statistics more convenient.
Currently, SuperMap iClient3D for WebGL supports querying field properties based on the specified field name, and supports setting its characteristics based on the selected value in the field property.
This document will explain in detail how to set the thematic map effect according to the field according to the effect of the example. The main operation process is as follows:
Operation process
The following will take some building data in Chongqing as an example to demonstrate the process of generating thematic maps.
1. Data preparation
Steps:
(1) Create a new spherical scene in the Super Map desktop product (hereinafter referred to as the desktop) and open the vector dataset (if you get the white film cache, you can jump directly to 3. Publish 3D services):
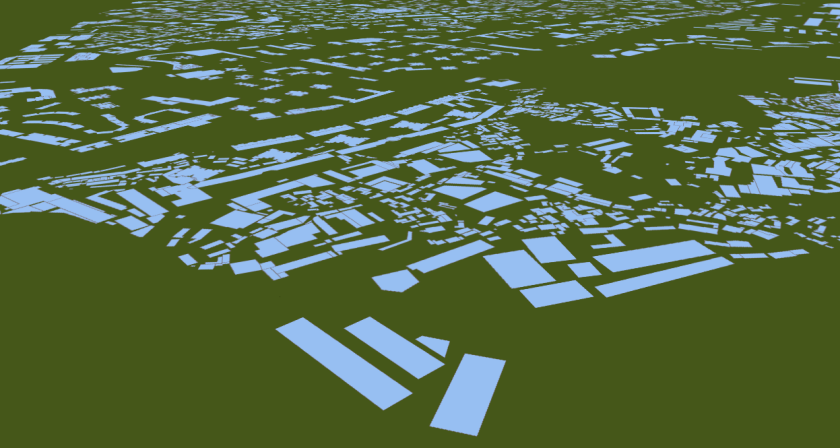
Figure 1: Schematic diagram of vector data set
(2) In the workspace manager, under the data source, click the data set to be generated for the white film cache, right click, Select "Browse Attribute Table", browse the values of the fields to be generated thematic map, and process the default values or obviously incorrect values.
If you need to add a field, in the workspace manager, click to select the data set, right-click to select "attributes", and select "attribute table" in the attribute edit box on the right. Click the "+" sign to create a new field at this time, edit its name and type, etc., and click "Apply" after completion to apply the new field to the data set.
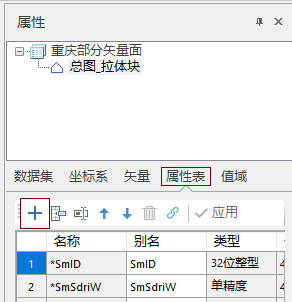
Figure 2: Schematic diagram of adding attribute fields
2. Generate albuginea cache
Operation steps
(1). In the "Generate Cache" group in the "3D Data" tab, click the "Generate Model Cache by Surface Stretching" button, A prompt box will pop up at this time. To ensure the efficiency of cache generation, it is recommended to click "Yes".
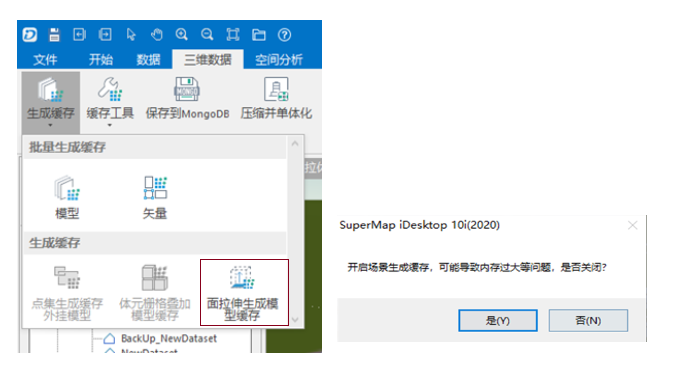
Figure 3(a), Figure 3(b): Schematic diagram of the function of generating vector albuginea
(2). Then the "Surface Extrusion Generate Model Cache" dialog box will pop up, as shown in the figure below.
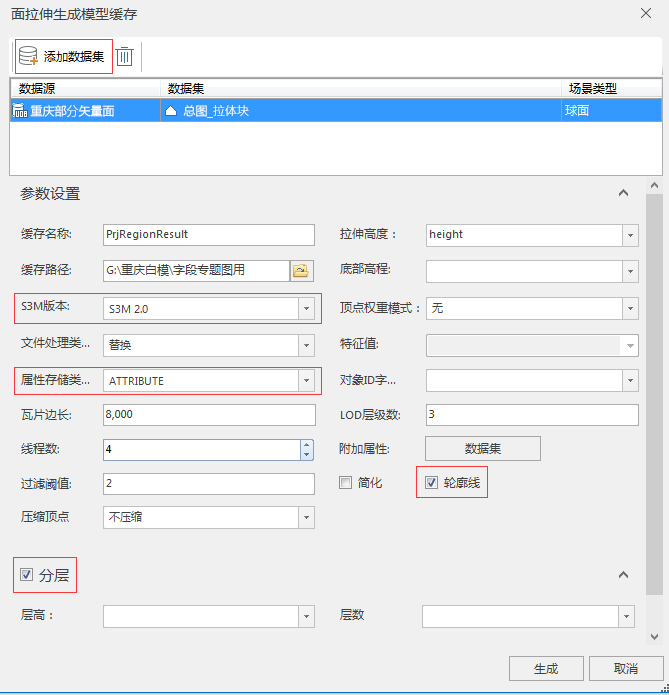
Figure 4 Model cache generated by surface stretching
Click the "Add Data Set" button to select the data set to be cached, that is, the data set processed above.
Parameter settings:
- Cache name: Set the name of the generated cache.
- Cache Path: Set the storage path of the generated cache.
- S3M version: The default is S3M1.0. If you need to select a field of string type to set the thematic map later, please select S3M2.0 here.
- File processing type: Please choose whether to "replace" or "append" as needed.
- Tiles side length: Set the side length of the tiles of the generated cache. The larger the geographic range of the data, the larger the tiles should be.
- Stretching height: Select the field based on the stretched height of the generated albuginea buffer, generally select the building height.
- If you want to set a border line for the albuginea later, please check "Outline"
- If layering of architectural white film is required, please check "Layering" and select the corresponding fields for different parameters.
The generated cache result is shown in the figure below:
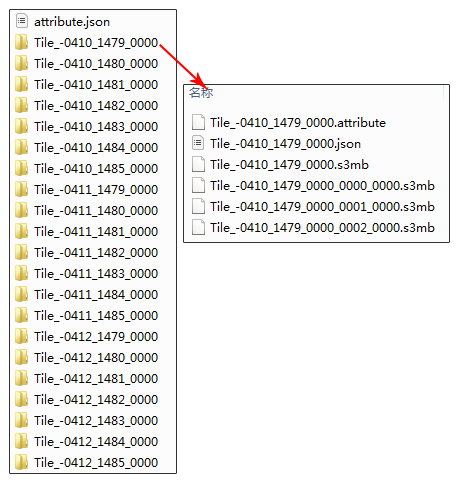
Figure 5 Schematic diagram of the generated cache
At this time, you can view the generated white film cache on the desktop:
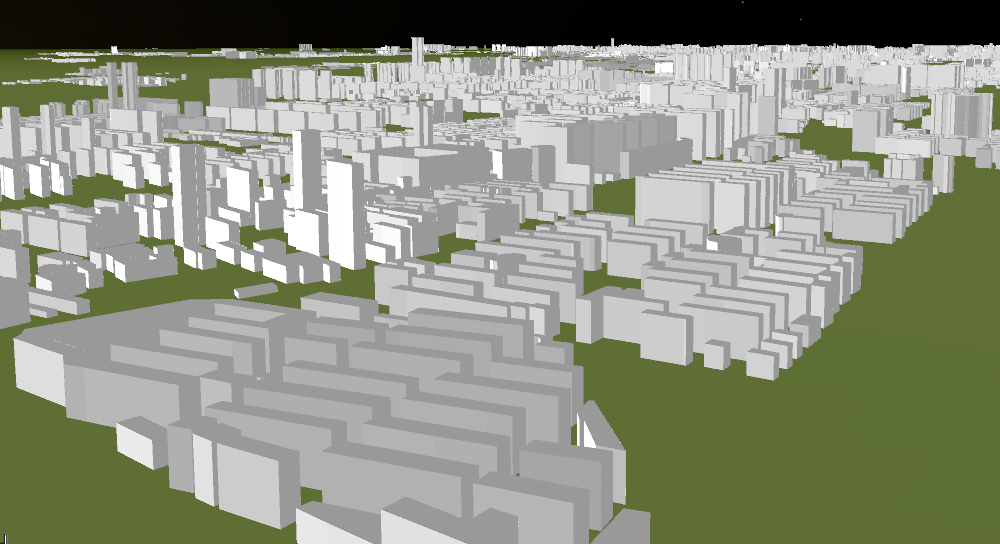
Figure 6: White film cache
3. Publish 3D services
Configure the workspace in the desktop and publish it as a 3D service in SuperMap iServer. For the specific process, please refer to the singularization of tilt photography model And the description in the "Publishing 3D Service and Data Service" in the attribute query operation manual.
4. Client load data
Operation instructions
In this step, load the published 3D service and set the initialization style for the data.
Load the service with the following code:
			viewer.scene.addS3MTilesLayerByScp(URL_CONFIG.SCP_JINJIANG, {
			name:'s3m'
			});
Set the initialization style when loading, the following code sets a black border for the white film:
                        for (var j = 0; j < layers.length; j++) {
                            _layers = layers;
                        layers[j].indexedDBSetting.isGeoTilesRootNodeSave = true;//local cache root node
                        layers[j].residentRootTile = true;// Root node resident memory

                            _layers[j].style3D.fillStyle = Supermap3D.FillStyle.Fill_And_WireFrame;
                                _layers[j].style3D.lineWidth = 1.0;
                                _layers[j].style3D.lineColor = new Supermap3D.Color(0, 0, 0, 1);
                            _layers[j].wireFrameMode = Supermap3D.WireFrameType.EffectOutline; //Sketch mode, ie wireframe
                        }
The effect of loading on the front end is shown in Figure 7:
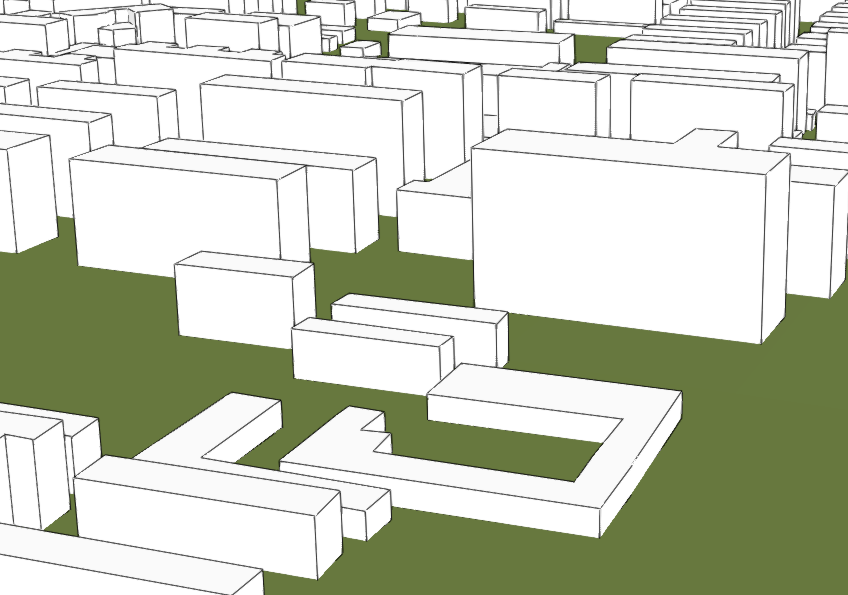
Figure 7: Setting a wireframe for the albuginea
5. Set thematic map
Operation instructions
Set the thematic map style according to the different attribute values of the field. For example, the following code sets different values of the floor field to different colors. Of course, you can also reset the border line style of the model.
					var colorConditions1 = [];
					colorConditions1.push(['${Floors} <10','rgb(204,204,0)']);
					colorConditions1.push([' ${Floors} >= 20','rgb(102,204,255)']);
					colorConditions1.push([' ${Floors} >= 10 && ${Floors}<20','rgb(255,102,0)']);
					colorConditions1.push(['true','rgb(255,255,255)']);
					_layers[j].themeStyle = setSupermap3DTileStyle(colorConditions1);
The effect is shown in Figure 8:
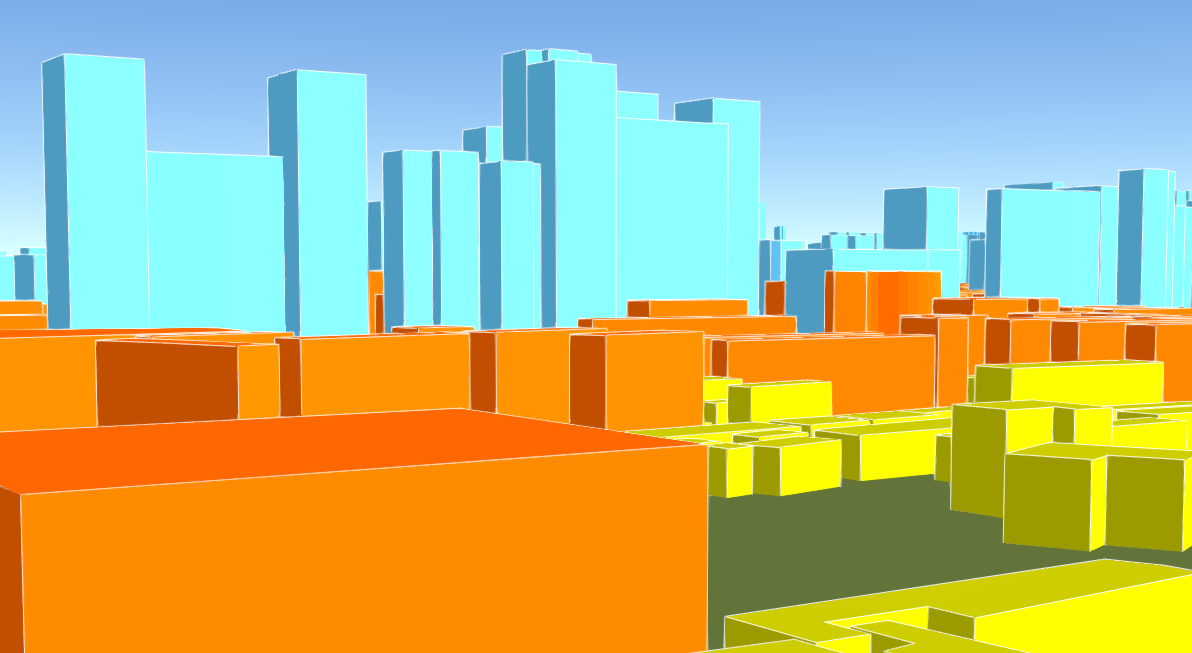
Figure 8: Schematic diagram of the effect of setting thematic map according to the height of the floor
If you want to set the thematic map according to the string type field, you can use the following method to set the style:
					colorConditions2.push(['${LandUse} === "House"','rgb(255,153,153)']);
					colorConditions2.push(['${LandUse} === "Commercial Land"','rgb(102,255,102)']]);
					colorConditions2.push(['true','rgb(255,255,255)']);
The effect is shown in Figure 9:

Figure 9: Schematic diagram of the effect of setting thematic map according to the height of the building