The production process of connectivity flooding analysis effect
Usage scenarios
How to more realistically and dynamically simulate the flood spreading process in the SuperMap product system based on terrain and oblique photography data?
This document introduces data processing and loading on the client side. The products involved include: SuperMap iDesktop or SuperMap iDesktopX, SuperMap iServer, client.
Production Process
a. Data processing
1. Generate DSM from oblique photography data
- ①Use iDesktop or iDesktopX to load the oblique photography data into the spherical scene, and open a data source.
- ② Use the "Generate DSM" function in the 3D analysis -> model output to generate a raster dataset for the oblique photography data. The data range is the union of all layer ranges in the current scene, and the custom data range is the result data range that can be set by selecting or drawing a face.
- ③Resolution setting: The smaller the resolution, the finer the data and the more accurate the effect, but the longer it takes to generate the data
- ④Camera height setting: Just tens of meters higher than the highest point of oblique photography data.
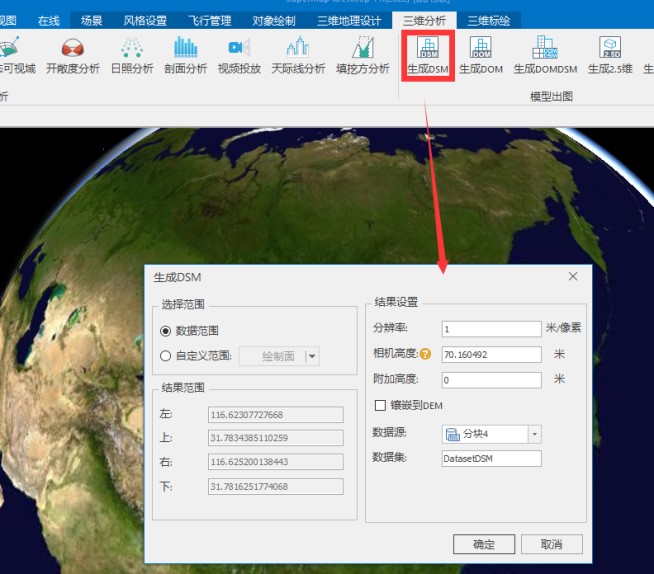
Figure 1
2. The oblique photographic data needs to be "inclined into the warehouse" operation, which is convenient for loading and using on the webgl side.
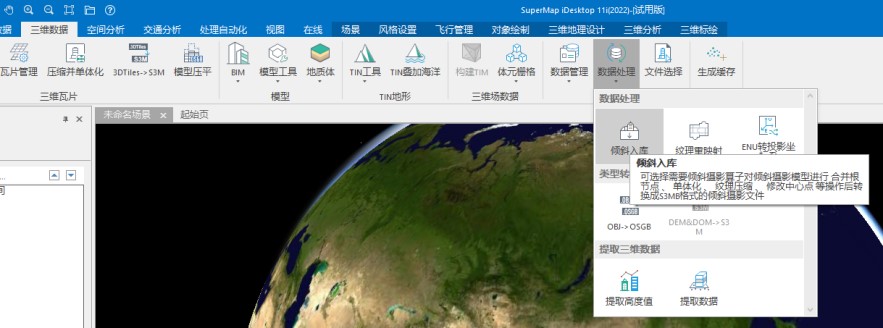
Figure 2
Instructions for setting tilted storage parameters: It can be set according to different data and requirements.
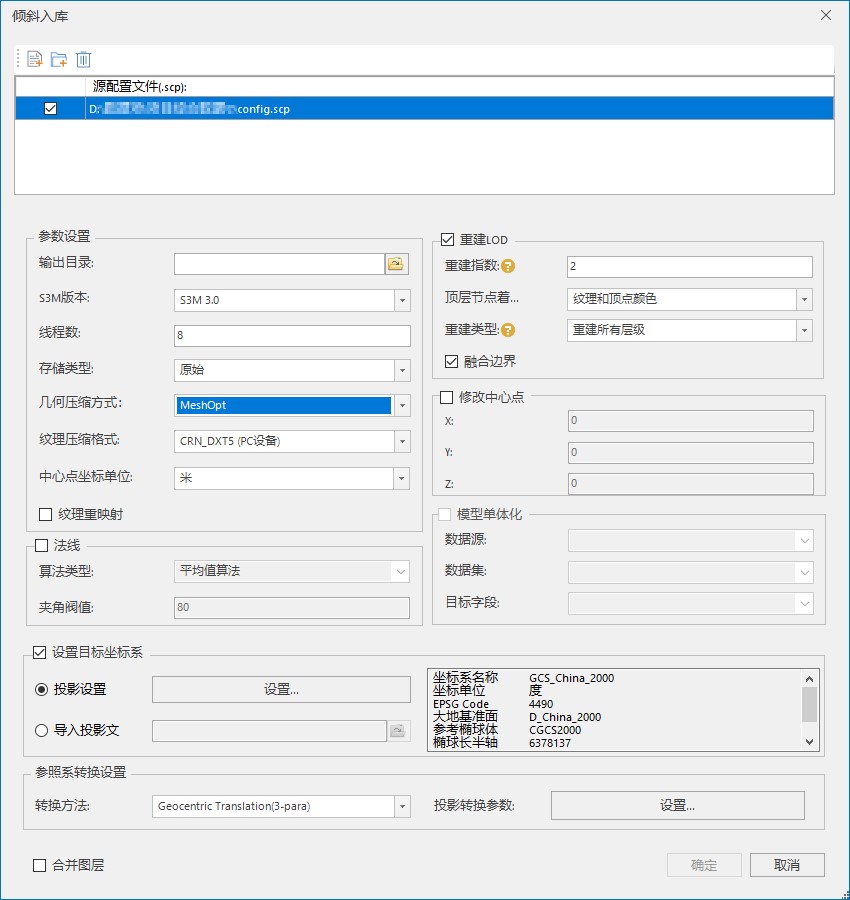
Figure 3
- ①S3M version: Support three S3M version numbers, S3M1.0, S3M2.0, S3M3.0, it is recommended to use the latest S3M3.0. If you are using a product package prior to 10.21, load the skewed cache file. It is recommended to use S3M1.0 when tilting into the warehouse.
- ②Number of threads: Set the number of threads for tilt storage operation, the default is 8.
- ③Storage type: If it is necessary to encrypt oblique photography, the storage type must be compact. If you store tilted cache files in MongoDB, the storage type must be primitive.
- ④Geometric compression methods: Four compression methods are currently available, and the time required for compression is in order from shortest to longest, no compression, conventional compression, Draco compression, and MeshOpt.
- ⑤Texture compression: currently supports five compression formats: WebP, DXT (PC equipment), CRN_DXT5 (PC equipment), standard CRN, KTX2.0, the default is DXT (PC equipment). For data with different purposes, different texture compression methods can be used to reduce the amount of video memory used by texture images.
- 1) WebP: A texture compression format that greatly reduces the total amount of data and is supported by both PC and mobile terminals.
- 2) DXT (PC device): Reduce video memory usage and improve rendering performance, but the total amount of data will increase.
- 3) CRN_DXT5 (PC device): Reduce video memory usage and reduce the total amount of data, but it takes a long time to process.
- 4) Standard CRN: Reduce video memory usage and reduce the total amount of data. It takes longer than CRN_DXT5 to process the same data.
- 5) KTX2.0: Reduce video memory usage and reduce the total amount of data. It takes longer than standard CRN to process the same data.
- ⑥Center point coordinate unit: If the center point coordinate unit of the original configuration file is METER, select meter.
- ⑦Texture remapping: It is used to solve the unreasonable texture splicing in some oblique data and improve performance. It is not checked by default.
- ⑧Rebuild LOD: You can set parameters such as reconstruction index, top-level node coloring type, and fusion boundary.
- ⑨Reconstruction index (same as the previous pyramid level): It is used to set the number of mergers, and the system will process N times of mergers as 4.
Note:
- ①The source data of oblique storage supports both .scp files in OSGB and S3MB formats, but does not support simultaneous storage of scp files in both formats.
- ②The oblique storage function currently supports data in ENU and projected coordinate systems, but does not support data in planes without projected coordinate systems.
- ③The oblique warehousing function only supports the coordinate transformation of the unified reference ellipsoid (projection to geography), and does not support other coordinate system transformations.
- ④ If you want to merge multiple oblique photographic layers with the same center point into one layer after oblique storage, you need to check the merge level.
- ⑤When adding encrypted oblique photography data to the scene, a password is required.
- ⑥When the data of the ENU coordinate system is tilted into the warehouse, if it is loaded on a spherical surface, the target coordinate system must select EPSGCode:4326.
Load the oblique photographic data into the scene, open the data source where the DSM is located, save the scene and workspace, and close the current scene.
b. Publish service
1. Release 3D services and data services
We saved the scene in the previous step, and then we will publish the 3D service and data service, the specific steps are as follows:
- ①In the %SuperMap iServer_HOME%/bin directory, click the "startup.bat" batch file to start the SuperMap iServer service.
- ②Open the browser, enter http://localhost:8090/iserver/manager in the address bar to enter the "Service Management" page, and click the "Quickly publish a service or a group of services" button under the "Homepage".
- ③The "Quick Publishing Service-Select Published Data Source" dialog box pops up, select "Workspace" in the "Data Source" field, and click "Next".
- ④The "Quick Release Service-Configuration Data" dialog box pops up, click the "Remote Browse" button to select the previously saved workspace, and click "Next"
- ⑤The "Quick Publish Service-Select Published Service Type" dialog box pops up, check "REST-3D Service" and "REST-Data Service", and click "Next".
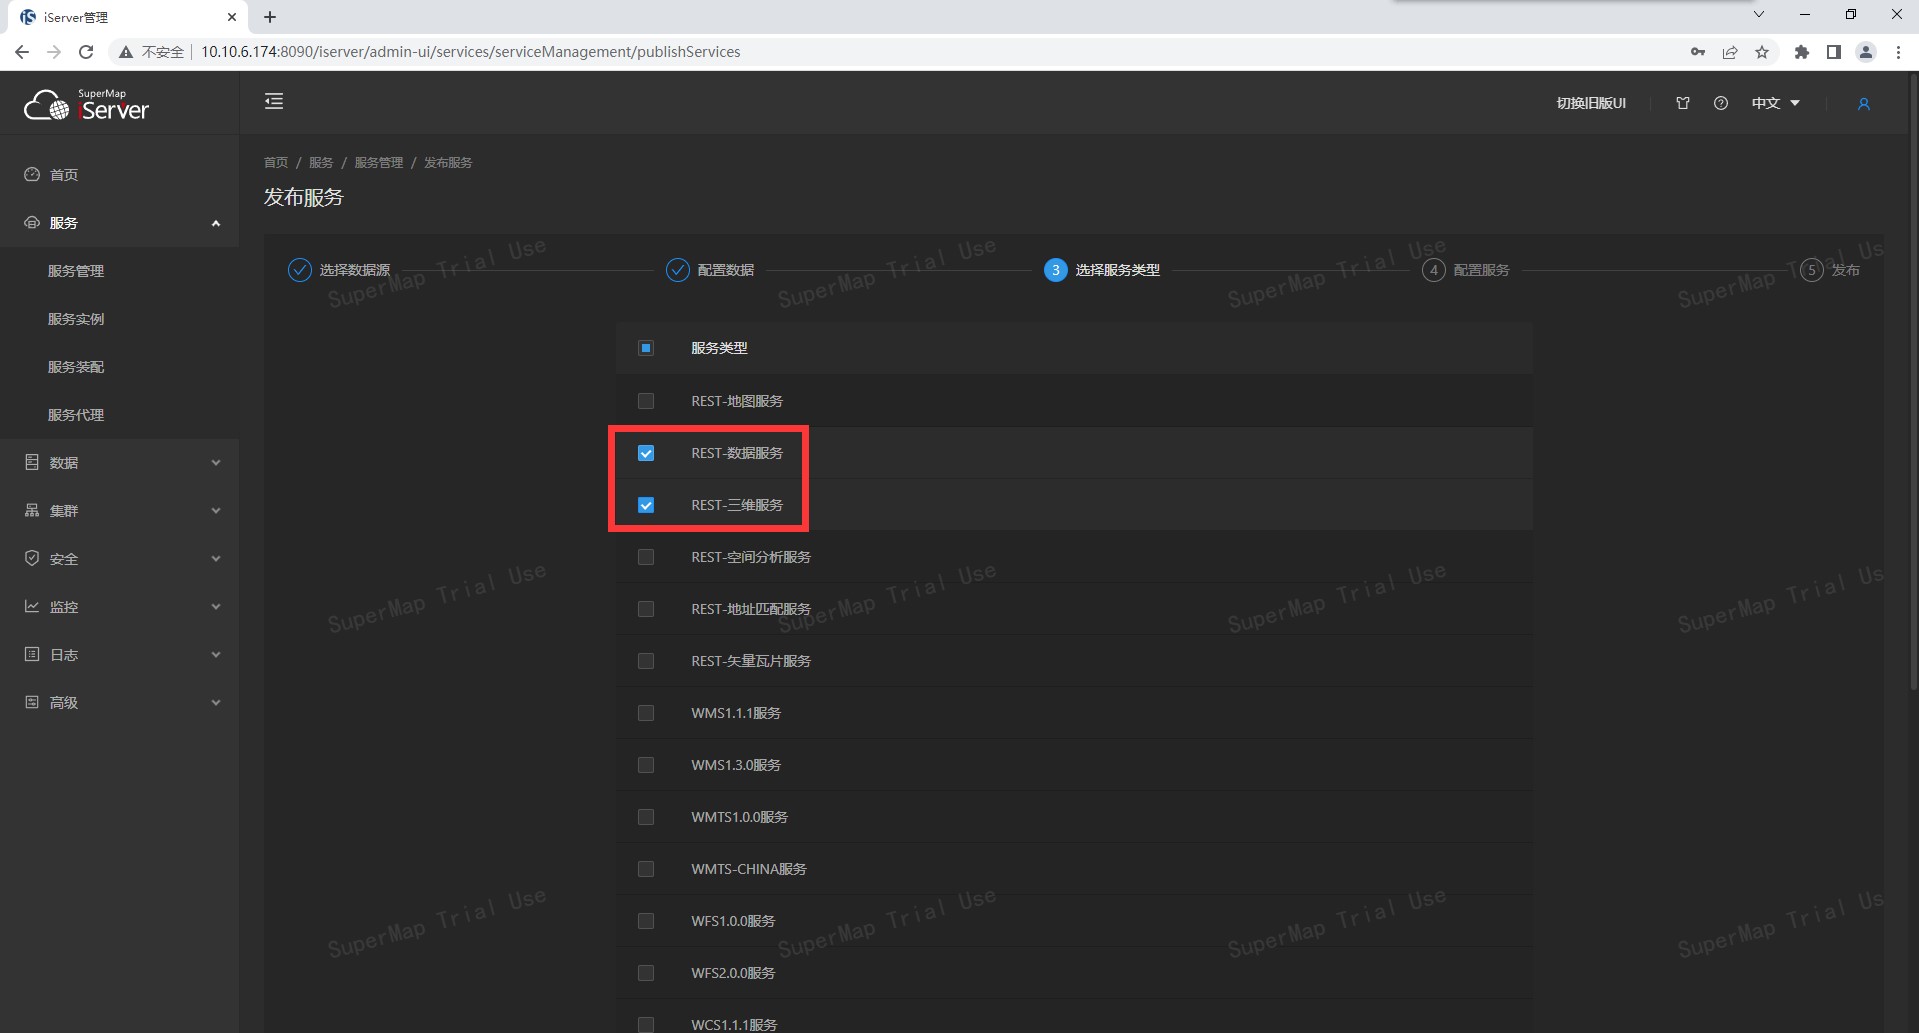
Figure 4
c, client loading
1. In the 11i product package, there is a connected flooding analysis example (ConnectedFooldingAnalysis.html) for reference.
2. The specific method is as follows:
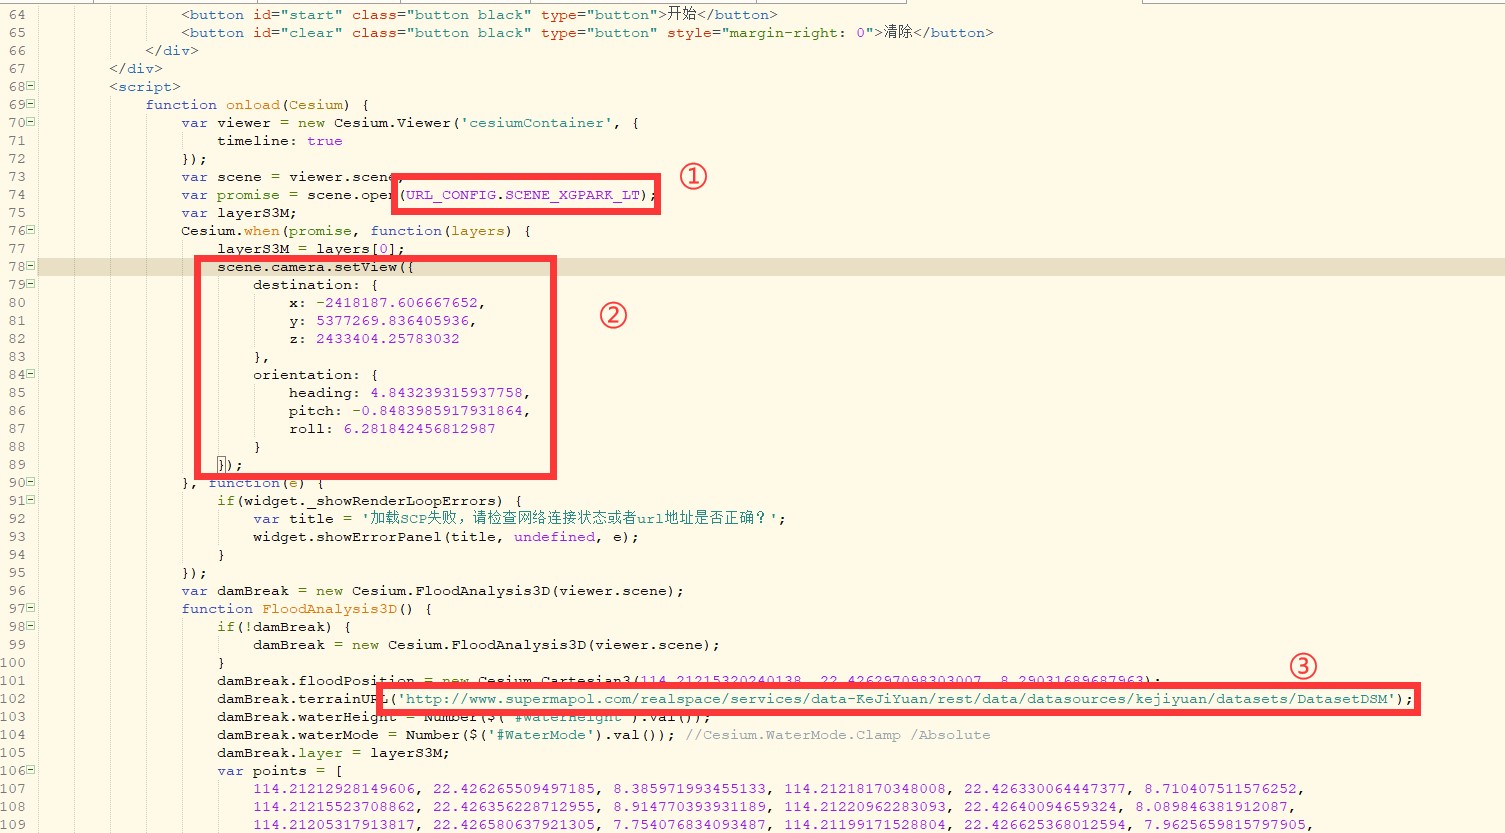
Figure 5
In Figure 5 above,
- ①Replace with the locally published 3D service address.
- ②The position of the camera needs to be changed, or it can be omitted, and it can be opened directly from the perspective when the scene was saved on the desktop.
- ③Replace it with the address of DSM data service.
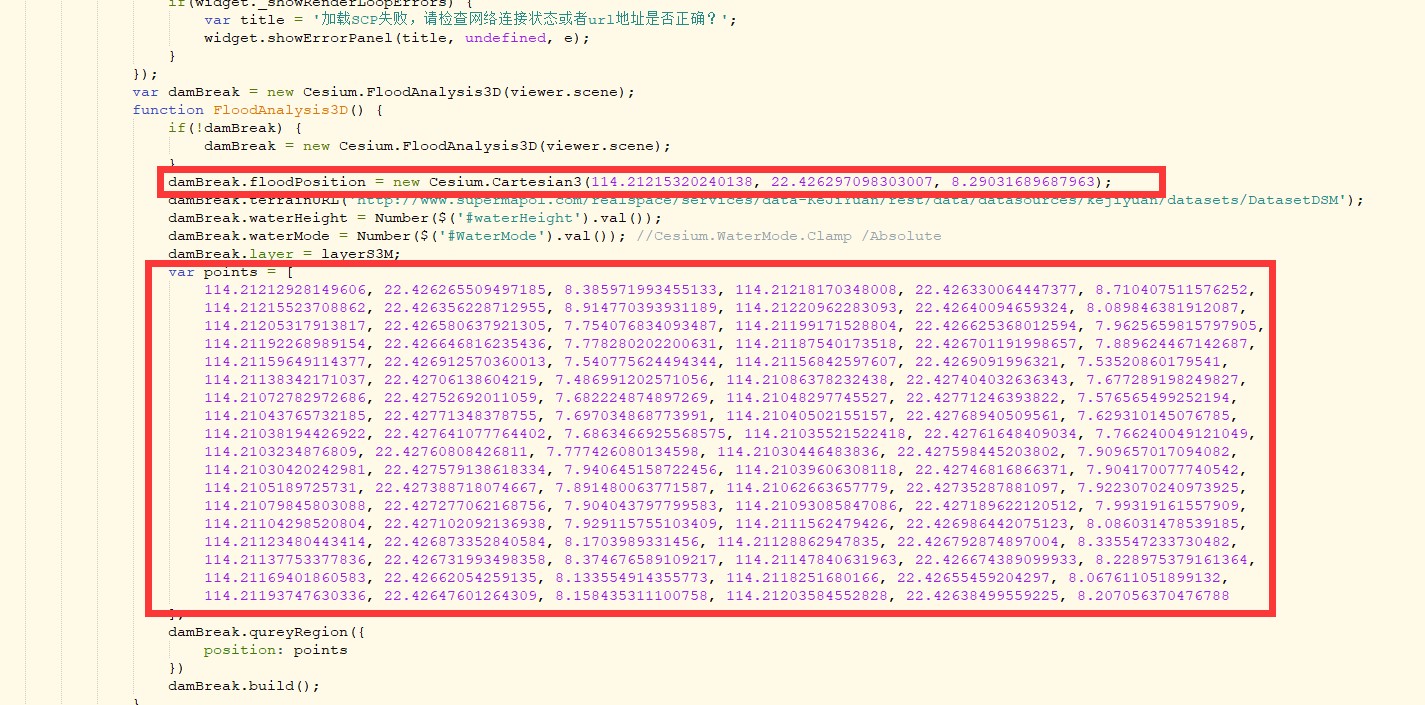
Figure 6
In Figure 6 above,
- ①damBreak.floodPosition: refers to the initial water outlet position.
- ②Points: The flow area that constitutes the water flow. Use "Coordinate Query" on the desktop to obtain the value of the coordinate point of the flow area and copy it to the page. If there are faces forming the water flow in the data, you can directly copy the value of the node to the page.
Save the modified html page and run it in the browser. You can choose the water surface mode (ground stick/absolute height) and set the water surface height value to adjust the required submersion effect.
Note:
1. Please use the latest SuperMap iDesktop/ iDesktopX, iServer and client versions on SuperMap official website
- SuperMap iDesktop http://support.supermap.com.cn/product/iDesktop.aspx
- SuperMap iClient3D for WebGL http://support.supermap.com.cn/product/iClient.aspx
- SuperMap iServer http://support.supermap.com.cn/product/iServer.aspx